Patriks Data Lager Blogg

Detta är Patrik Lagers blogg med reflektioner, ideér och goda råd till alla som jobbar med Data warehouse och Big Data.
Blogginläggen är Patriks egna och behöver nödvändigtvis inte representera Top of Minds åsikter eller ståndpunkter i alla ämnen. 

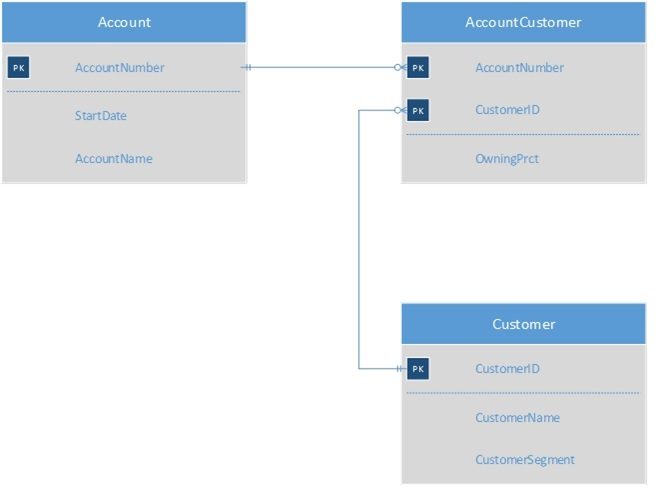
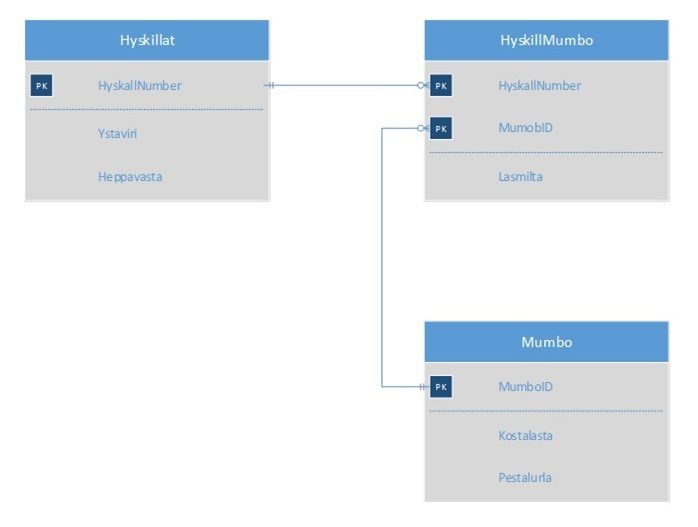
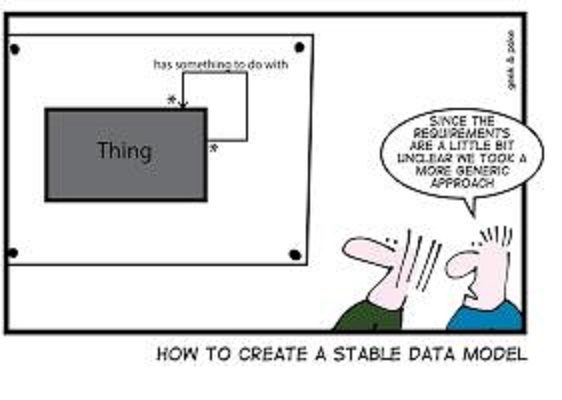
Musings on Data Modelling

What is the fundamental purpose of Data Modelling? In my mind, it is about creating an understanding on how things work in real world, in a specific context, and draw a picture of it, the picture is the Data Model. To do that we need to define the things we are modelling and the reason we define things, events and so on is to achieve an understanding of the world we model, in a specific context. So the main purpose for doing a data model is to achieve understanding and not just your own enlightenment but also to create a common understanding with the people that are active in the context we are modelling. One thing I have noticed of the years is that good definitions of what we are modelling is often lacking. Look at the model below, which shows part of a model for the context of Card Payment, what is the first question that pops up in your mind?

Maybe you check the cardinalities on the relationship? Maybe you check the attributes in the boxes? Maybe you wonder why there is no name on the lines that goes to the relationship object (AccountCustomer). But the main question that should pop up in your mind is – what are the definitions on the entities and the relationship.

One big issue we have when doing data model sessions are well known “labels” (name on things). Because we are carrying our own definition of each of the labels we are working with, we have (our own) understanding of what an Account and a Customer is. We can relate to them. Therefore it is easy to jump over the step of defining the entities, since that might end up with a lot of discussion when we all of a sudden realize that the other people in the room have their very own definition of the entities in question. But wait, wasn’t that the reason why we should do this Data Model session in the first place – create common understanding.

Try this “mumbo jumbo” model instead

What is the first question that pops up in your mind? Probably, you now want to know what “Mumbo” etc. Stands for, what its definition is and so on. Since you don’t have an own definition/understanding of that label.

Now let’s return the industry I work in, Analytical systems design and implementation. A lot of time we work with goal to achieve common representation of data from an Enterprise context, that means the Customer defined, not only for the Card Payment process but what the Enterprise as a whole sees as a Customer. Now it starts to get really hard and probably the reason why a lot of people in my industry rather speak about “technical” parameters of Data Modelling as, if the Data Modelling technique is agile, reusable, if lends itself to automatic implementation patterns, what normalization level it has, how well it supports query performance etc. Instead on how do we create good definitions in a data modelling session? I include myself in that group of people; I do talk a lot about those Data Model “technical” things, but on the other hand, I really believe in the power of good definitions to achieve common understanding.

But let’s go back to the reason for definitions – to create a common understanding in the context you are modelling. How does that help us when implementing an Analytical System, well if you want to integrate data over system boundaries with a Subject Oriented view and not store data by system tables/files, you need the definitions. How could you otherwise know if the data from a specific system should enter the table/file in your Analytical System? So it is impossible to build a Subject Oriented Analytical System without definitions of the data model in the context (Enterprise, Division or Department etc.) that the Analytical System should represent data, so why is it, that almost everywhere you go, the people that work with definitions are none existent or very few, when it is a primary prerequisite to build that kind of system. We have a multitude of architects, designer, data modelers (the technical kind), and developers and so on but very few people working with creating common definitions

One reason I often hear when I talk to people in these projects is that they think it’s not their work, definitions on entities should already been established or someone else should do it, but then we end up in a waterfall approach, where we can’t implement data into our Analytical system, since we don’t have any definitions on entities. That is one of the reasons we also see more and more of these source system copy systems, we don’t have the time to wait on the definitions on entities, so let’s dump the source data into another machine and let the analysts figure out what the data is, which is the classic Copy System design, you can read about the issues (independent of modelling technique) with that design approach in this previous blog post.

In these days of agile development where sprint teams should be self-sufficient, everyone needs to know how to create a good definition otherwise they aren’t really self-sufficient.

When I check the latest Data Modelling/Big Data/Data Warehouse conferences that have been or are in the near future, there are no tracks or even single seminaries on, the importance of definitions and how to write a good definition in a data modelling session. It’s all about “technical” aspects on data modelling. The courses on Analytical Systems are all about data modelling technique, performance, implementation patterns, software and hardware, not on the importance of definitions and how to create them.

I think it’s time for our industry to start educate our self in creating, writing and maintaining good definitions and lift the importance of that for building Analytical Systems. 7 years ago (time flies) I wrote a paper on Definitions and their use for Integration of data. If you are interested to get a deeper explanation on my view for use of Definitions for data integration you can follow this link – ToM-Report-series Data Warehouse Defintions for Integration


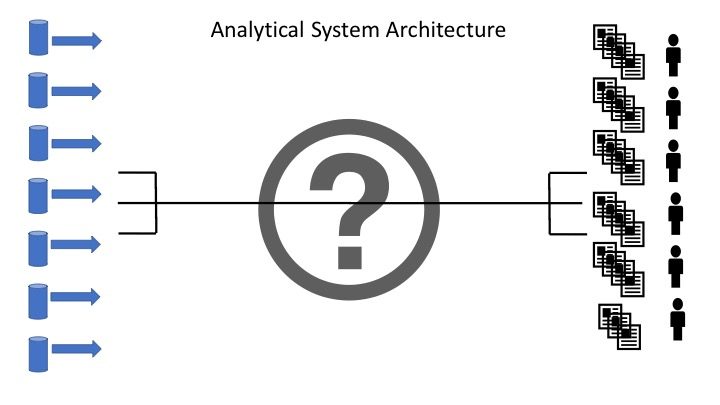
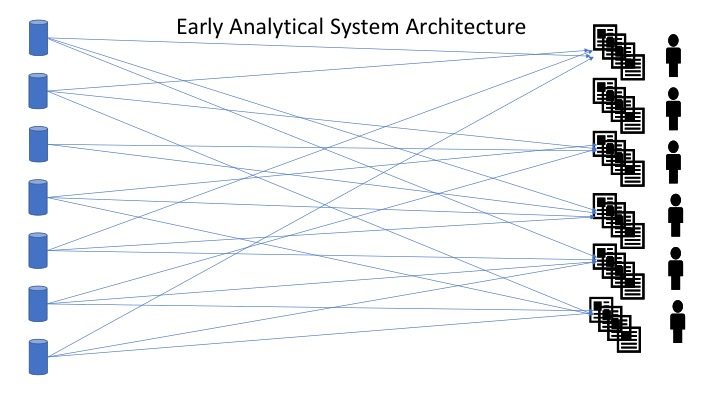
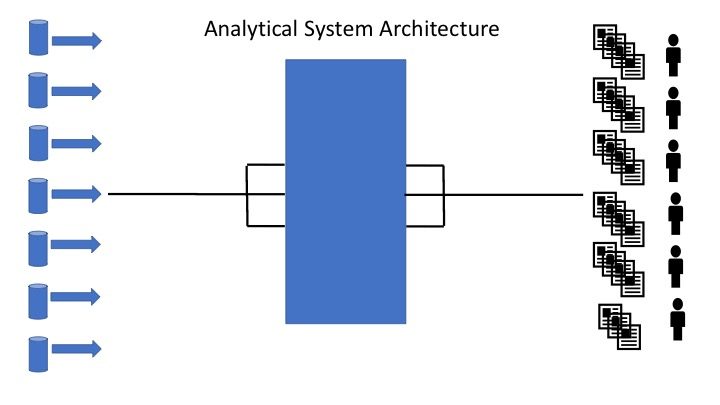
Thoughts on Architectural blue print

Earlier this year had a wonderful time when I was on vacation in Barcelona. One of the things I visited was La Sagrada Familia. The amazing cathedral in Barcelona, designed by the famous architect Antoni Gaudi, I recommend a visit if you ever is in Barcelona. After I came home I started to think about issues I often find when I come to companies and looks at their Analytical system(s), it is often a mess and when you ask an architect for a blue print of their vision/architecture of what they are to achieve with the analytical system(s) they are building, the documents are often on so high level that it can’t be used support any design for what they should build or it is a chart of what tools they should use or a list of reporting requirement. I find it very strange that in our industry, analytical system design and implementation, there is a very strong ad hoc approach. I would say that analytical systems are one of the harder things to design and implement in such way that it is maintainable, scalable and have a long life span. I would say that without a vision/architectural blue print of how/what/when/were/why data for analytical use is to be produced and consumed is such way that the solution will be stable over a long time, you will not succeed, long term.

Some would blame the agile movement when it comes to project/sprint approach but I disagree. Once again, the La Sagrada Familia, is a project that has been ongoing for over 100 years and is planned to be fully finished by 2026, 100 years after Antoni Gaudi died but the Cathedral is functional today and can hold service and also be used as a huge tourist attraction, so it is already delivering business value even it its built one sprint at a time, but still the blue print vision/architecture is followed, they know what to build and how and when, since they have a blue print to follow, knowing what needs to be achieved. One great example is that the highest tower, the mid tower, is not built yet, but the pillars that shall hold up the tower is already designed and built to handle the stress of the mid tower when it is built. Without the vision and the blue print that would not have been done.

So is this possible in our industry? I would say that it should be mandatory to get that blue print in place before you build anything, the blue print is not about the exact analytical function, but on how the system framework should work, how things should be implemented and where in the architecture they should be implemented, and what we want to achieve with this system, from a non-functional requirement view. We need to be engineers in our mindset, not “coders”, everything can be solved with code, but it is seldom maintainable and/or scalable in the solution as whole. The mentality – let’s try it out and see if it works, will not create a stable, maintainable analytical system, neither will the approach – the end user wants this, so let’s build exactly that, without understanding how it affects the whole system, will also fail from a long term perspective.

One thing that I think drives our industry into the “coding/build” mentality instead of the “engineer/design” mentality, is that we are one of the few industries that gets payed to redo bad solutions. That is not very common, in other design/building industries, there you are responsible of your design/product and if you made something wrong, you will have to redo it – without payment, you might even be sued for more money since you might have wreaked some ones daily work or living. So you take care, and think it through on a full scale before committing to building anything.

But our industry don’t have to design or plan how our solution will work in a whole, because the people hiring us, will pay us to redo it later, they might even pay us three, four, five times to get it right and then after a few years pay us again to rebuild the whole solution because it was not scalable and/or maintainable, since we didn’t really understand how the whole system should work. Our accountability is almost none existent.

So before we build our next analytical system(s), please get the non-functional requirements inplace, draw the architectural framework and set the how/what/when/were/why things will happen in the architecture, before we build the first analytical function/report.


Ensemble Identifiers (Focal Theory)

In the Focal theory there are two different identifiers, Identifier(s) (IDFR) and Secondary Identifiers (SecId). 

 The IDFR is defined as follows
”IDFR identifies an unknown Instance of a defined Ensemble and represents the Instance life cycle from cradle to grave” 

 The SecId is defined as follows
“Secondary Identifiers are identifiers that the business might use to search for an instance in an Ensemble. The identifier does not need to be unique for one instance. All ID’s that is used as IDFR’s will also be in the SecId concept” 

 In the Focal theory the IDFR has one purpose only and that is to ensure that the integration of instances is correctly executed, without resulting in duplicates or key collisions, therefore the IDFR follows a specific pattern.  

The Secid representation is as source sends it with no consideration of possible duplicates or key collisions. The SecId is used to support business search of specific instances of data and only has to be true in a specific point in time. 

This is done so we can have a separation of concern in the implementation. IDFR focus on achieving the correct integration of instances, the SecId support business search. This way they will not interfere with each other’s function and be suboptimitzed to support both requirement as the same string 

IDFR Pattern 

In Focal theory the IDFR has a specific pattern to ensure that it is unique and that it integrates different sources of data for a specific instance of the defined entity (Ensemble) if the Instance gets the same IDFR. 

Here is the description of the different parts of the IDFR string.
idfrtoken||id”.  

IDFRTOKEN 

The idfrtoken is an alphanumeric string that is 8 characters long, its purpose is to ensure no key collisions and that integration of instances from different sources of data is correctly applied. The idfrtoken is built out of two things, Owner and IdfrType. 

OWNER represents an entity that owns, governs and sets the ID that is used to identity the unknown instance of the defined Ensemble (Focal), the entity can as an example be a data system or an organization.  

IDFRTYPE is used to ensure that if one OWNER can identify two different Instances with same ID series, the IDFRTYPE is used to ensure uniqueness between the two different Instances. 

ID 

ID is the identifier string that the OWNER sets for a specific Instance. 

The ID can be a concatenation of multiple attributes. 

Examples 

Here there are some examples on how these parts in the IDFR string is used to ensure no Key Collision and Integration. 

Life Cycle of Ensemble Instance example 

To start we will look at the life cycle aspect of the IDFR definition. The idea is that an IDFR should represent the life cycle of the unknown Instance of the defined entity (Ensemble). 

In this example we look at the identification of a Mobile Telecom Subscription by using the mobile phone number (MSISDN) and why it does not work very well in an analytical system even when the Business uses it to identify a Subscription/Subscriber.  

From an operational business perspective, the MSISDN is a viable identification of a Subscription and should be used as a SecId, since at a specific point in time a MSISDN can only belong to one Subscription. From an analytical perspective it is not good enough for the simple reasons that it is possible to change MSISDN without starting a new Subscription or keep the same MSISDN and start a new Subscription. If the MSISDN was used as an IDFR for the Subscription Ensemble and then owner of the Subscription changes its MSISDN the analytical system would then count that as a New subscription had entered the system, which is not true in this case.  

What more that happens is that “old” MSISDN, that subscribers have changed from, will be reused for new Subscribers that might enter the Telecom company for the first time and therefore signs a New subscription. In this case the analytical system would recognize the MSISDN and use that existing data instance as a representation of the New Subscription and we would lose the correct history of the Subscription.  

Another scenario is that a subscriber changes its Subscription, might move from a Company Subscription to a private subscription when the Subscriber stops working at the Company but is allowed to keep the MSISDN and therefor the MSISDN is moved to the New subscription. The analytical system would keep the same Subscription and update its information, which is wrong, since we would not then see that it is really a New Subscription that has entered our analytical system 

As you can see the MSISDN does not work as an IDFR for a Subscription, since it does not represent the Subscription from cradle to grave. It is important to understand, that some Identifier that work for the operational business view does not work for the analytical system as an IDFR from a life cycle and Time variant perspective of an analytical system. 

OWNER Example 

The use of OWNER is important to get a correct IDFR. In this example we will look at a key collision example by having an Ensemble representing Deposit Account. The ID used to identify a Deposit Account is the Account Number. In this case the IT landscape has two different Deposit Account systems that will load the Deposit Account Ensemble. The issue is that they both use a number series and the same Account Number can come from both systems, but it is not the same Deposit Account instance. By concatenating the System before the ID as a representation of the OWNER the IDFR string will differ and two different Deposit Account instances will be created as the data enter the analytical system. 

It is important to understand how/where/when an ID is created so the analytical system can, because it is not only about avoid Key Collision, also to achieve integration when correct to do so. Adding system in front of every ID will ensure most of the Key Collisions issues does not happen but will hamper the ability to integrate data between different sources. In this example we look how to use OWNER to achieve integration. 

Bonds and Stock paper uses a global identification called International Securities Identification Number (ISIN). Those ID’s are issued by the ISIN organization. If we would have an Ensemble for Security Paper, which then could contain Bonds, Stock, Obligation etc. now the information of a specific Security Paper could come from multiple different sources and also even external sources. In this case it is not good to add Source as the OWNER since then no Integration would be achieved and the analytical system would have multiple duplicates of the same Security Paper. By adding the ISIN organization as the OWNER for all Sources of data that sends the ISIN as the identification, the IDFR would look the same independent of the source of the instance and integration will be achieved.  

There could be an argument to not use the OWNER when using a Global Identifier like ISIN, but there is always the danger when creating an Ensemble that the same ID series might enter and not identifying the same instance, in this example if some source sends another identifier that for some strange reason has the same ID string as another ISIN Id. It is good practice to use OWNER to ensure that the control of Integration and Key Collision is in the analytical system design and not by luck. 

IDFRTYPE example 

IDFRTYPE is the most seldom needed part of the IDFR string.  But there are some cases where it is needed to ensure that Key Collision does not happen. This is one real life case where it was needed. A large financial institution had an Ensemble representing Loan. In the IT landscape there was a large IT system handling all kinds of Loans. The Loan system design was so that each type of loan had its own table with its own number series which were the Loan number. A Mortgage Loan and a Leasing Loan or Blanco Loan could all have the same Loan Number. By adding OWNER (System in this case) to the IDFR string did not differentiate the IDFR string, it was still the same. But by setting unique IDFRTYPE on each Loan type the IDFR string got unique. 

Core Business Concept Model 

A given argument when it comes to these issues is to put the data in their own Ensembles, Leasing Ensemble, Mortgage Ensemble and so on. From a Focal Theory that is not the way to solve it, since it makes the analytical system to be IT system driven and not Business driven. If the Core Business Concept is Loan for a specific Bank, then that is what should be implemented. Not solve Key Collision and Integration issues by building the data model to ensure no Key Collisions, since the Key Integration is just one part of the Integration logic that an Analytical System must handle. 

Conclusion 

The Identifier strings that work from an operational perspective, might not always work from an analytical perspective. In the Focal Framework this is handled by the use of IDFR strings that follows a predefined pattern which sole purpose is to ensure that integration is correctly applied and that key collisions are avoided. 


Analytical Systems architecture and design patterns – Part 2

This is the second part of the design pattern of an analytical system, for more background read the previous blog post –Link–

The blog series is aiming at explaining how and why we need to build an Analytical Systems in a specific way, if we want them to have maintainability, scalability and longevity.

The Data Warehouse definition – the definition of an Analytical System

In the previous blog post we looked at the history of building analytical systems and how in the early 90’s we came to the conclusion that we need an “Associative Component” in the architecture to handle the many to many relationships between source data and user groups requirements.

I also wrote that the associative component in the architecture has to follow the Data Warehouse definition that Bill Inmon gave us in the early 90’s

“a subject oriented, integrated, nonvolatile, time variant collection of data in support of management’s decisions”

Now the definition can be interpreted in many ways, I will here describe my view of what this definition means and why it is important from an Analytical system design perspective.

Subject Oriented

Subject Oriented or Subject Area Oriented is an important part of how an Analytical System are organized.

For the Associative Component in the Analytical System Architecture we organize and handle our data in subject areas. This way we always know where to get certain kinds of data, independent of source of data. If we would store data according to source of data we would end up with a lot of various places to pick up data if the question about data spanned over multiple sources for a specific data concept, which most of the queries in an Analytical System does.

It might feel like a very small thing, but this is a fundamental part of designing and building an Analytical System. Then main reason why the subject area approach is so important is that it gives the analytical system the ability to disconnect the dependency between the source of data and the end user requirements. Since the sources of data that enters an analytical system is not created by the analytical system itself. It is dependent on the underlying systems that feeds it data. The underlying sources of data can and will over time be changed, and even removed from the IT landscape and replaced by new systems. If we build a direct dependency on specific source data and they change or even replaced, you will have a much broader effect on the analytical system than if we build it with an Subject Area Associative Component.

Integrated

Integrated can be seen as three different areas of integration. Structure (Subject Area), Instance and Semantic. That means that we create a data representation in the Associative Component that has the same Structure and semantic representation independent of source system.

I break it down in 6 levels, where each level is fundamental if the Associative Component will hold the data in a format the remove the many to many dependency between Source and User. Which is the really important if you want to build an Analytical System that is maintainable, scaleable and have a long lifespan as a system.

  1. Sourcing: The fundamental part of an analytical system is that we need to get our hands on the data. This can be done in many ways, but we do need to have the ability to use data from various sources.
  2. Subject Area: This is also called co-location of data. We organize data from various sources according to what Subject Area it belongs to, not by each source.
  3. Instance: This is a very important part of integrated, it’s about, that if a data instance within a Subject Area exist in multiple sources, the Associative Component in the analytical system has to have the ability integrate the various sources and only have one instance of it. Example, if a Customer exists in multiple systems and they all send data about the Customer the Analytical System should only have one instance of that Customer, independent of how many sources has information about that specific Customer.
  4. Attribute: The various sources of data often has their own naming conventions on the attributes. The Associative Component on the other hand has to keep its data according to one naming convention. This to make it possible to access data independent of source system.
  5. Domain Values: Certain Attributes has their stable values – it is like a list of values that a certain attribute can use. The source often has their own list of values that certain attributes can use, these must be translated as well. Otherwise you can’t really access the data independent of source.
  6. Format: We want the format for different type of data types to be the same, like date format. There are multiple ways of representing a date, but the Associative Component should have one.

If you handle data according the definition of the Associative Component instead by Source it will cater for a much stronger scalability, maintainability and a longer life cycle of the Analytical System. 

Let’s see how some different change scenarios affects an Integrated Associative Component versus a Source by Source architecture. (of course, these are simplified effects described but they represent the fundamental effects as a change happens) 

Base line – Eight systems handles product information that thirty different analytical functions has been coded against, there are reports, statistical models and AI scripts using the data. 

  1. Now we add a new source system of product data.  
    • Source by Source – All thirty analytical functions have to be rewritten to handle the new source. 
    • Associative Component – One system has to be mapped into the Product Subject Area and Integrated according to the six levels of Integration. Use Cases are untouched. 
  2. We want to create a new analytical function for products 
    • Source by Source – Nine different sources have to be mapped and understood in regards of the requirement of the analytical function. Then nine different sources of data have to be handled in the code, merged and integrated be the developer of the analytical function. The developer also need deep understanding on how each source systems works and all its legacy in its data to come up with a correct result. 
    • Associative Component – The developer accessing the subject area for product and need to translate the requirement to that subject areas data definitions. The developer need to understand the data model of the Product Subject Area but does not need to understand each and every source system. 
  3. An old system gets replaced with a new one 
    • Source by Source – All thirty analytical functions have to be rewritten to handle the new source. 
    • Associative Component – One system has to be mapped into the Product Subject Area and Integrated according to the six levels of Integration. Use Cases are untouched. 

These simple examples show the fundamental strength of the Associative Component when it comes to handle changes between the many to many relationships between the User and the source of data and simplify the usage of data. This way the Analytical System can grow and change both on the Source side as well as the User side and the Associative Component will help mitigate the effect of the change and in the long run create a more efficient development cycle. If you want to build an Analytical System that is be scalable, maintainable and have a long-life span, you need an Associative Component in your Analytical System architecture. 


Analytical Systems architecture and design patterns – Part 1

This series of blog posts will discuss system architecture and design principles to build an analytical system with maintainability, scalability and longevity. Further on, discuss the details in the design principles to give the analytical system agility, reusability and robustness.

These principles have been learned and explored the hard way, through empirical experiments (building analytical systems) and observing the results over the last 40 years of what works and what does not work. To understand why the principles of architecture and design of an analytical system are what they are, we need to go back in history before we knew what we know today.

The Copy System

In the 70’s and 80’s the data systems got more and more common. They were built to support different operational processes in the business. Even at this time the business understood that in all that data that was gathered in these operational systems there was knowledge to be used to support decision making. So, they wanted to use that data to understand how the company was doing. One issue was that the operational systems where fully occupied to support the business process and any analytical query against it would ruin its operational performance.

The solution was to offload the operational system on to another platform. Just copy the tables/files every month or so to the other platform and someone could start running queries against the data without disturbing the operational system.

Once the knowledge was extracted out to of an operational systems data, more questions from the business started to appear and these questions could not always be answered by data from one operational system, so we needed to off load data from more operational systems, this was done into the same platform as the first system, just by copying each operational systems tables/files. So the Copy System came to be, the first analytical system.

Figure 1: The first Analytical System – The Copy System

Now there was a system that had data copied from multiple operational systems. The data was stored according to the operational systems data models.

Since the Copy Systems were very much an afterthought in the IT landscape and there were no good architectural design principles for how to build and maintain these systems, they often had big problems of handling change of requirements for queries and problem when the underlying systems, who’s data that was copied, changed. These problems would escalate as more systems was copied and more query requirements where implemented.

The Many to Many Challenge

What is the fundamental challenges of building these analytical systems then? It is that there are two sides in the system (Ingestion and Access) and they have a many to many relationships between them.

  • Ingestion Area must handle
    • Multiple information areas
    • Multiple IT systems
    • Multiple Data models
    • Multiple local semantics
    • Multiple local identifications
  • Access area must handle
    • Multiple user groups
    • Multiple analytical/report requirements/use cases
    • Multiple granularities

Figure 2: Analytical System Architecture – Many to Many dependencies

This is a major difference between building an operational system and an analytical system. An operational system supports specific business processes. These processes have clear steps on what they want to achieve. The input of data in clearly defined and the output is well defined. The number of use cases/scenario the system should support Is limited and the user group of the system is well defined and limited.  On the other hand, an Analytical system has many different data sources and a lot of different user groups with a lot of different requirements to support multiple different processes.

This means that the analytical system does not know all the different requirements/use cases it will have to support in its life cycle. So how do you then design a system that does not know what requirements it is supposed to support?

In the early days (70’s, 80’s, 90’s) the architecture looked like this, or the lack of architectural design patterns made it look like this.

Figure 3: Early Analytical System Architecture and design

As we can see it is a mess of spaghetti lines with multiple dependencies on data and usage of data. Any time a new requirement/use case entered the analytical system, new lines of dependencies between users and data sources was created. This was of course not maintainable or scalable over time as new requirements and systems came in.

The Associative Component

So how do we handle these many to many relationships between Ingestion and access? We look how it is done in a data model, where we add an associative component when there is a many to many relationship. I have not seen it called that way any other place, but it is one way to describe what this componet in the architecture is meant to do – mitigate and handle many to many relationshipes between source data and user requirement.

Figure 4: Analytical System Architecture – the associative component

Now the definition of that associative component is the important part on how to build an analytical system. Bill Inmon gave us that definition in the early 90’s and it still stands.

“a subject oriented, integrated, nonvolatile, time variant collection of data in support of management’s decisions”

In the next part of this blog series I will describe my view on what the definition means and why it is so important if you want to build an Analytical System that will be maintainable and scalable over a long-time frame.